

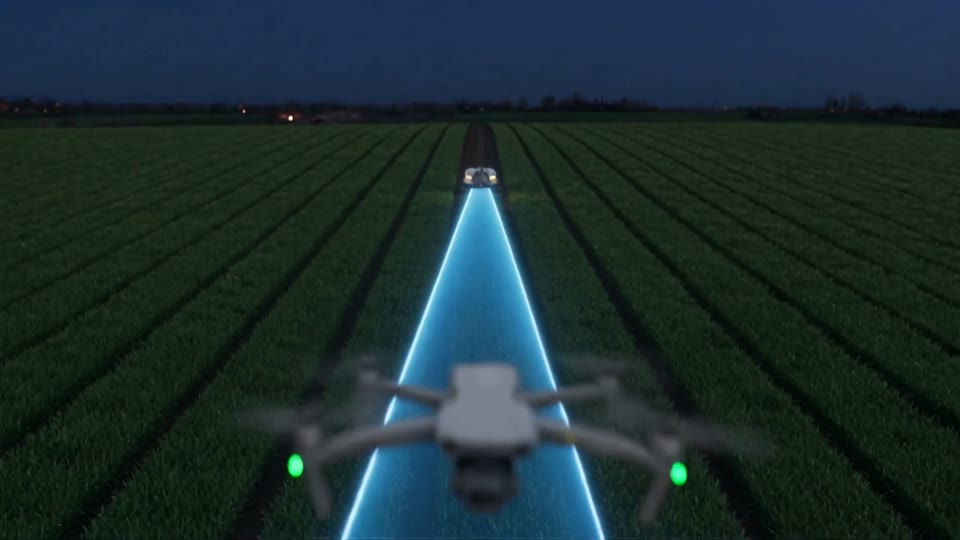
- 120m
- height
- 5.3cm/px
- resolution
- 75%
- overlap
- 200ha
- per flight
Sample telemetry · DJI Mavic 3M
Multispectral monitoring
The field read in five bands
With the DJI Mavic 3 Multispectral we survey up to two hundred hectares in one flight: vigour indices, stress zones, plant counts and prescription maps for the treatment.
The point
Data counts when it changes a decision
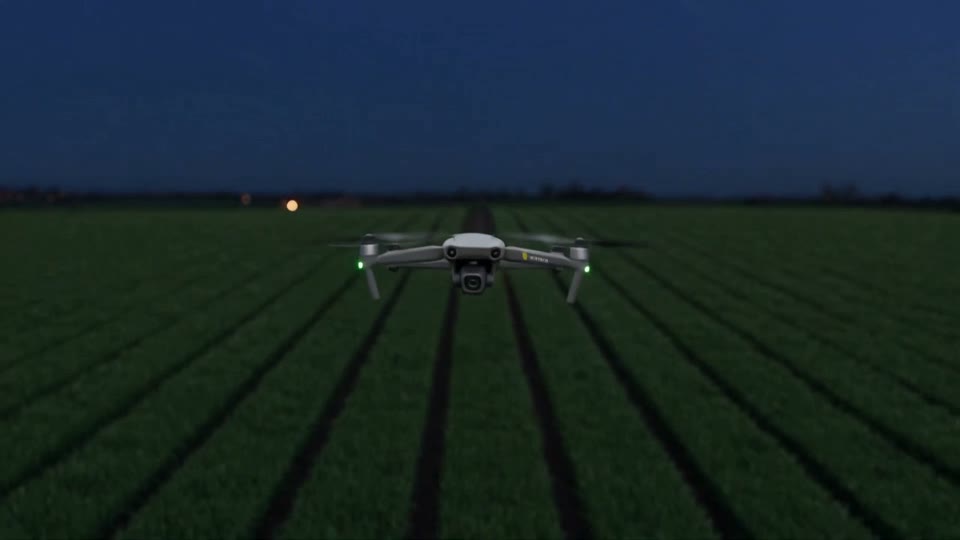
The green, red, red edge and near infrared bands see chlorophyll before the eye does. A water or nitrogen shortfall appears in the index two weeks before it appears on the leaf.
The survey is not the point, though. The point is deciding where to fertilise, where to irrigate, where to do nothing. So every flight closes with a reading alongside your agronomist, or ours.
RTK positioning gives every pixel a centimetre position: the same cell of the field compares flight to flight, and the prescription map goes straight into the working drone.
The same frame
What the eye cannot separate, the index can
Drag the handle. On the left the field as photographed, on the right the same field read as a vigour index: patches that look like a slightly different green become zones to check on the ground.


Illustrative simulation: the index is derived from the colours of the photograph, not from a multispectral survey. A real survey uses the red and near infrared bands, which a photograph does not have.
The five bands
Why stress shows in the infrared first
A healthy leaf absorbs red and reflects almost half of the near infrared. When the plant suffers, red rises and infrared falls weeks before the leaf changes colour. The four Mavic 3M bands sit exactly where the difference is largest.
Healthy plantStressed plant
NDVI = (NIR − Red) / (NIR + Red)
Values at the four bands
| Curve | Green · 560 nm | Red · 650 nm | Red edge · 730 nm | Near infrared · 860 nm |
|---|---|---|---|---|
| Healthy plant | 12% | 5% | 36% | 50% |
| Stressed plant | 16% | 13% | 27% | 35% |
Typical curves, not measurements of a field: they are here to read the diagram. The bands are those declared by the manufacturer.
What we do
The surveys
-
01
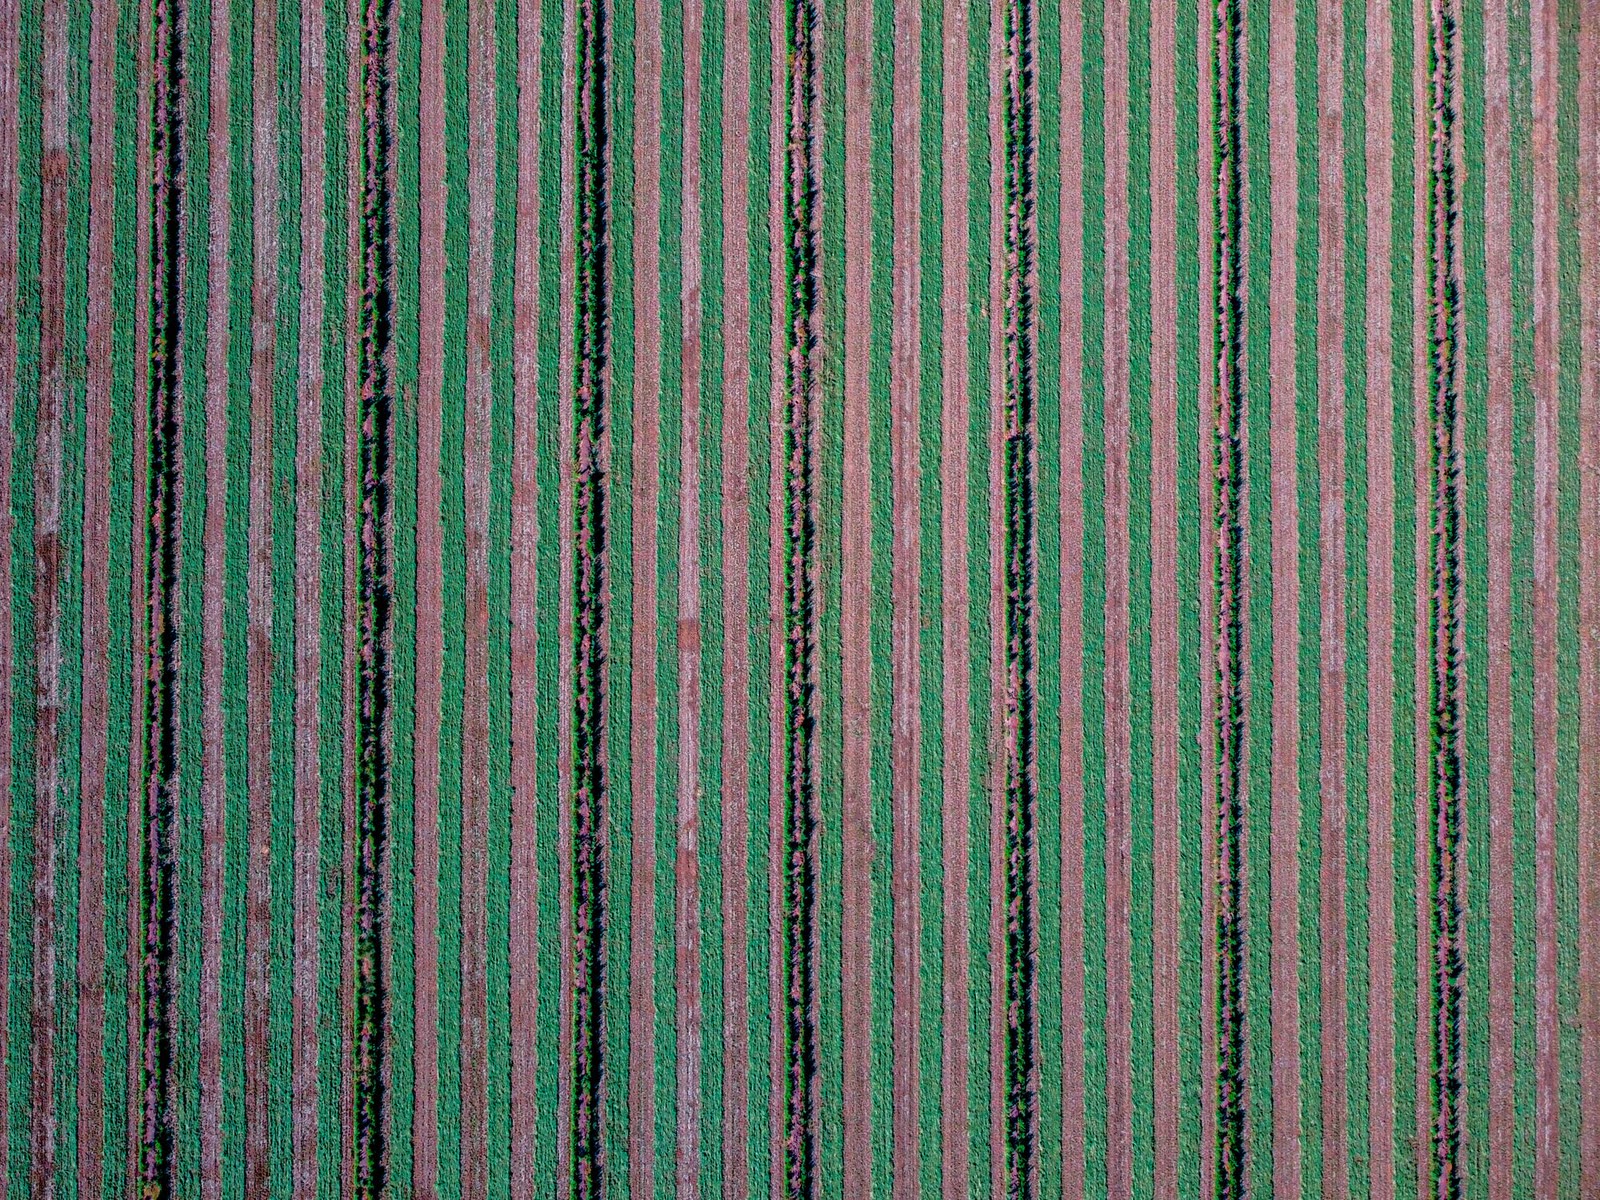
Crop status
NDVI, NDRE and GNDVI indices over the whole plot, with variability within the field and between fields.
-
02
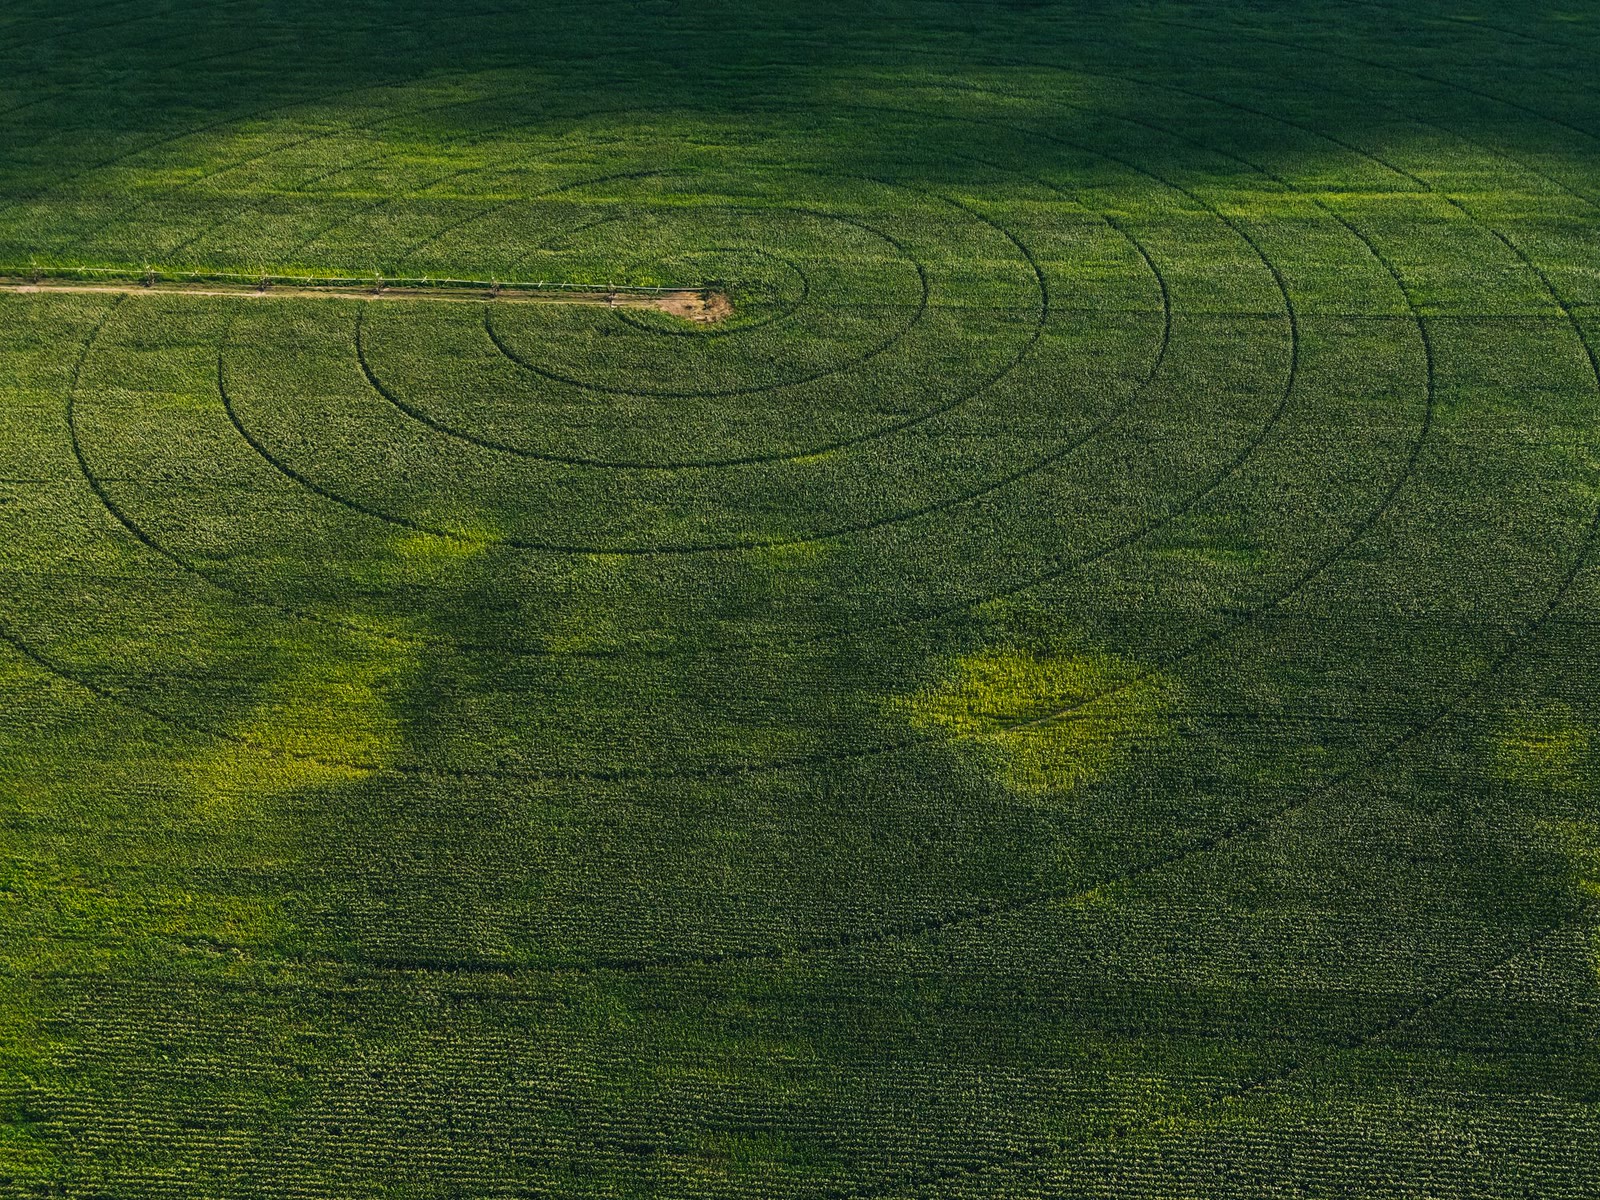
Stress zones
Water and nutrient deficits, waterlogging, attacks under way: zones are outlined on the map and checked on the ground.
-
03
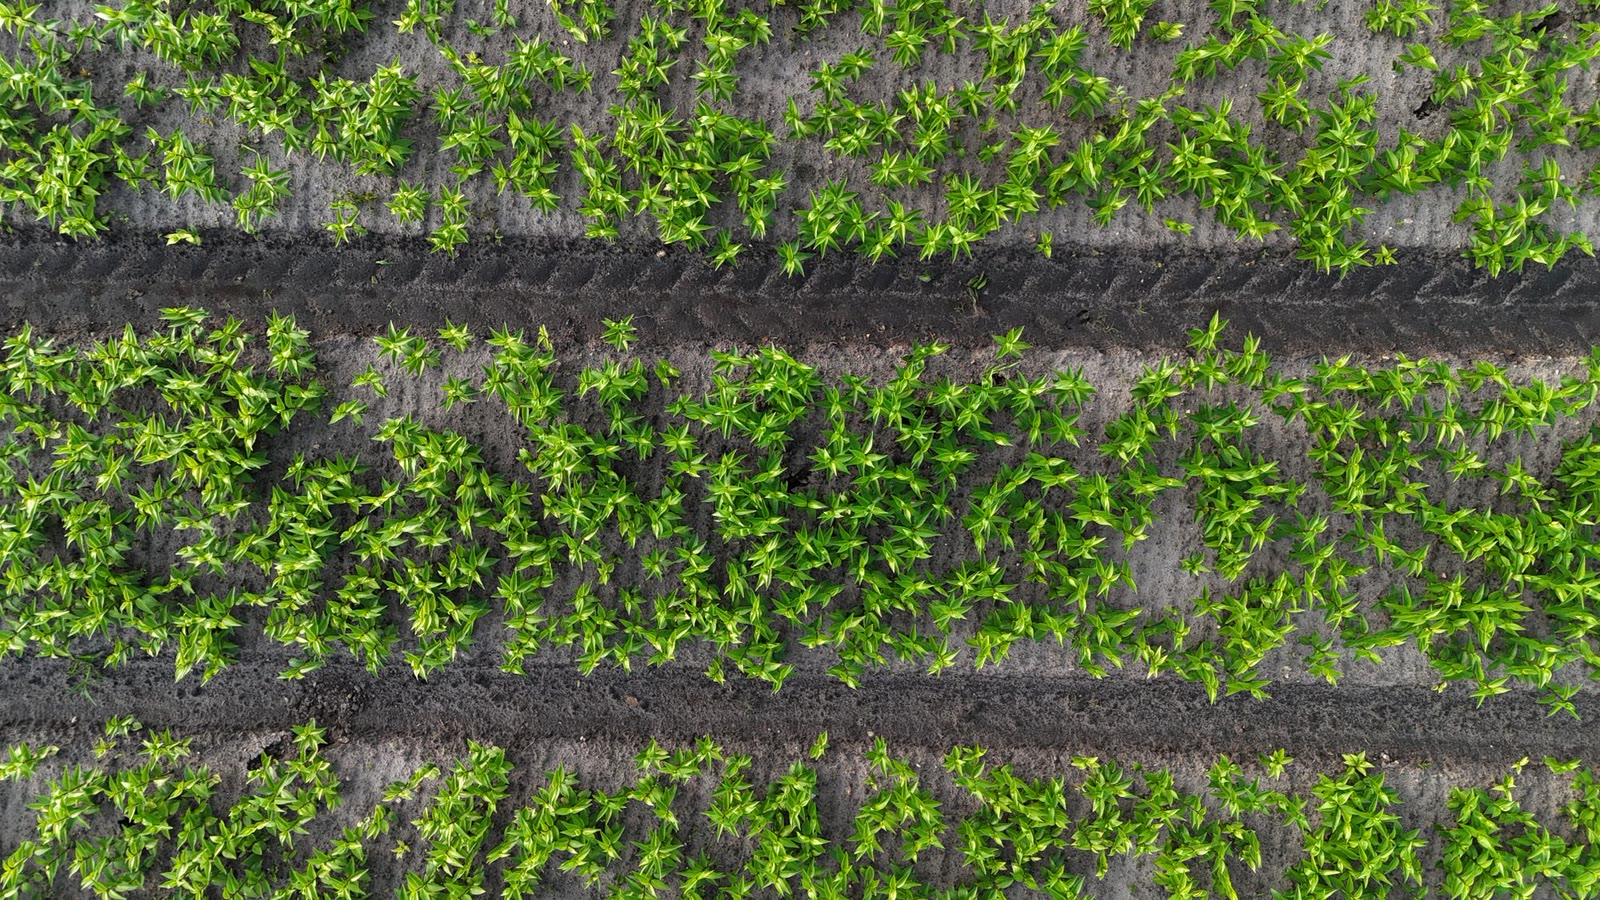
Counts and gaps
Emerged plants, gaps and sowing density on arable crops, vegetables and young orchards.
-
04
Prescription maps
Variable rate for fertilising, seeding or treatment, exported in the formats your terminals and our T100 read.
-
05
Change over time
The same field at fixed intervals through the season: what responded and what did not, with numbers.


How it runs
From flight to decision
-
 01
01Flight
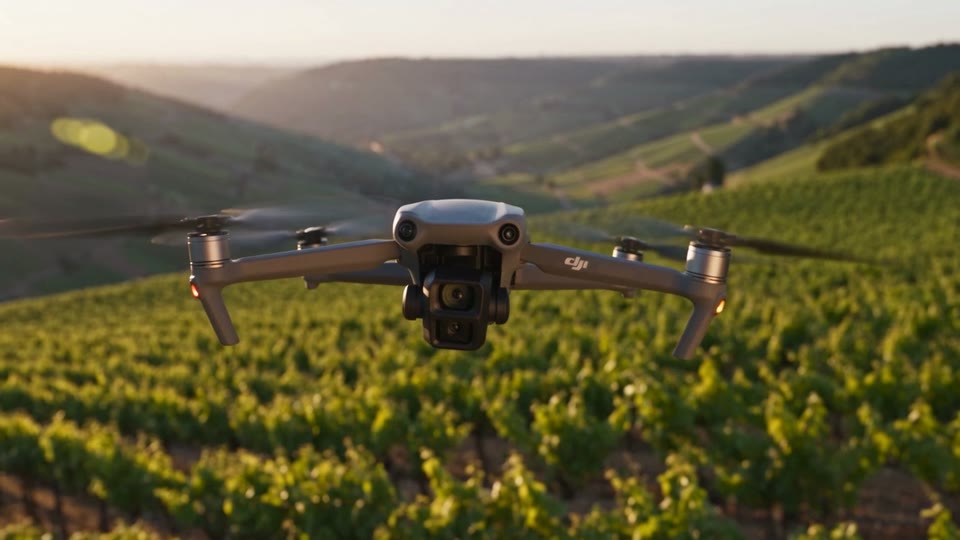
Automatic route over the plot, height and overlap set for the crop. One hour for two hundred hectares.
-
 02
02Processing
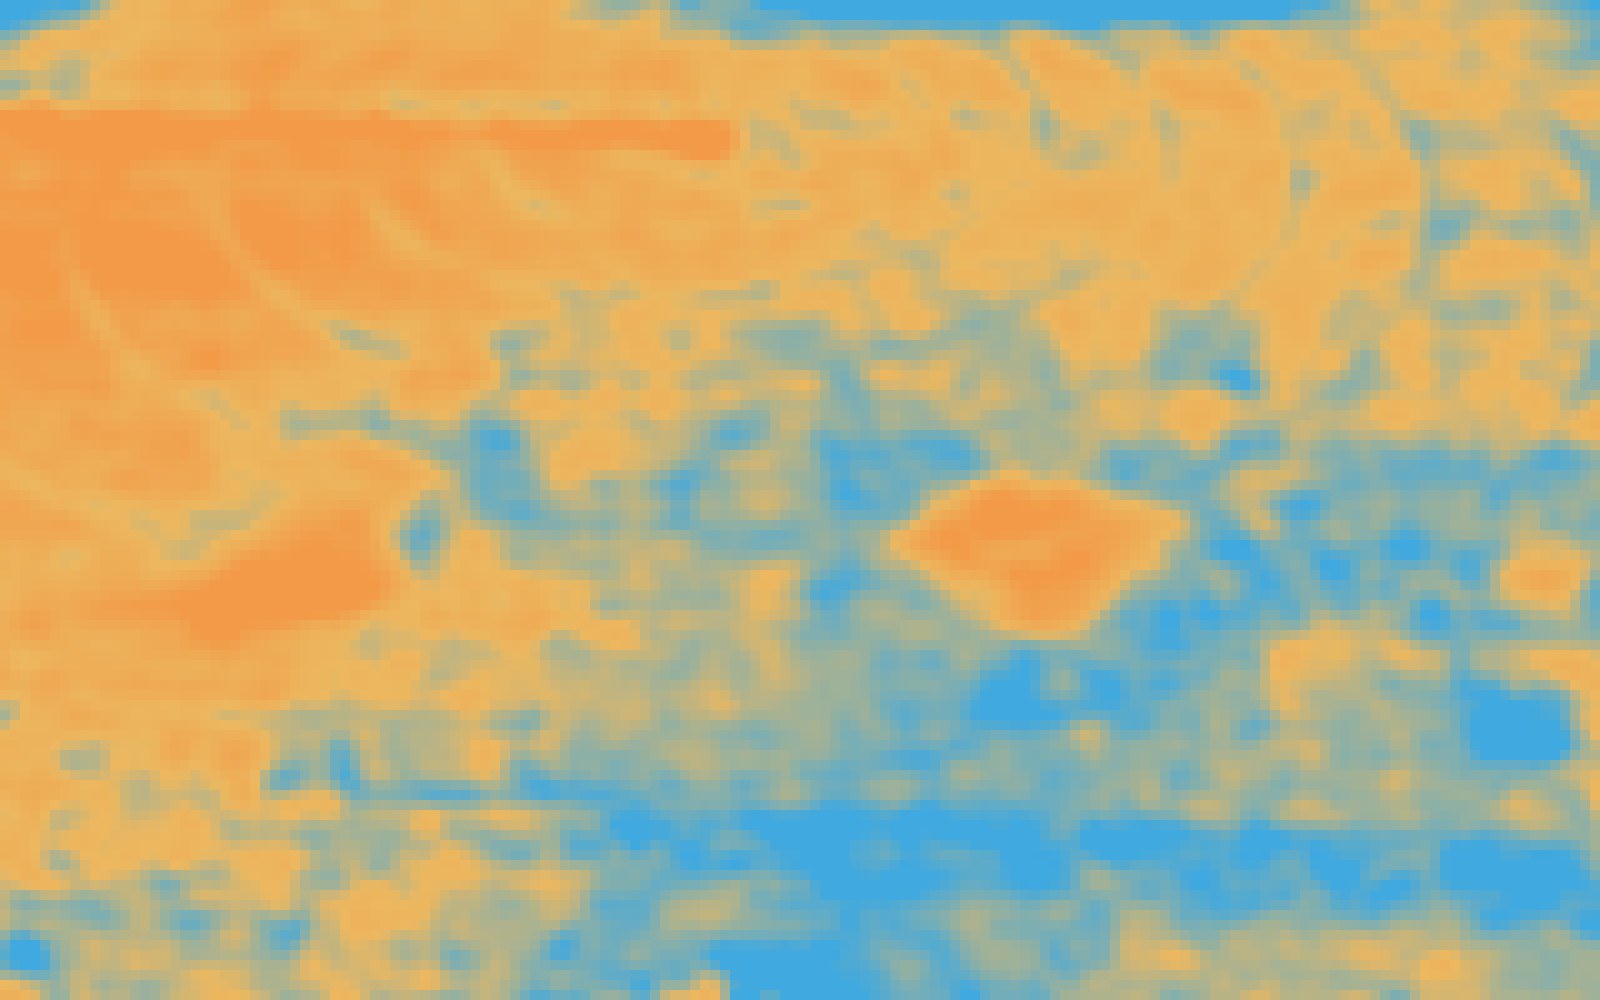
Orthomosaic, indices and variability map within two working days, in formats anyone can open.
-
 03
03Reading
Half an hour at the table with the agronomist: what the map says, what to do, what to watch at the next flight.

Prices
Price guide
| Survey | Area | From |
|---|---|---|
| Single multispectral survey | up to 20 ha | €220 |
| Single multispectral survey | over 20 ha | €9 / ha |
| Seasonal plan, four flights | up to 20 ha | €720 |
| Prescription map | per survey | €80 |
| Plant count and gaps | per survey | €60 |
Indicative prices, VAT excluded. The reading with the agronomist is included in the first survey.
Questions
Before you write
How many flights does a season need?
It depends on the crop. On maize and wheat four flights at the key stages are enough to guide decisions; on vines and orchards a monthly rhythm from April to September pays off.
Do the maps work on my spreader?
Yes, in the ISOXML and shapefile formats that the main manufacturers' terminals read. They also go into our T100, if we do the application.
Does it need good weather?
It needs stable light: full sun or uniformly overcast. The onboard sunlight sensor compensates for variation, but with patchy cloud the data do not compare well and we postpone.
The first survey comes with the reading
Tell us crop and area. We tell you when and how much.